


- Published on: 2026-10-26 02:07:52
Trading Consolidation Zones: Understand Sideways Price Ranges

A quiet chart can still be setting up its next move. Trading consolidation zones are sideways phases in which price moves within a range as buyers and sellers pause and reassess. The range can break in either direction, and its next move cannot be predicted with complete certainty.
A pause can feel like a lack of opportunity, especially when price keeps turning near the same highs and lows. Reading the boundaries, price action, and momentum can help you distinguish a developing range from a breakout attempt. Learn what creates consolidation, how to mark a range, and how indicators and candlestick patterns can add context to your analysis. That gives you a clearer plan for sideways markets, rather than treating every move beyond a boundary as a confirmed signal.
Key Takeaways
- Recognize a sideways phase by tracking repeated price turns between support and resistance, rather than assuming every pause signals a reversal.
- Mark the range boundaries and wait for a candle to close outside them before treating a move as a confirmed breakout.
- Watch for false breaks that can trigger stop-losses, especially in extended ranges, and look for momentum or a retest to add context.
- Map the broader range on a higher timeframe, then use a lower timeframe to refine potential entries and seek confirmation.
- Use tools such as Bollinger Bands, ADX, RSI, and candlestick patterns as supporting evidence, not standalone predictions.
1. What is consolidation in trading?
Consolidation is a market pause in which price moves sideways instead of making sustained progress upward or downward. Buyers and sellers repeatedly meet near familiar price levels, creating resistance above and support below. The range can appear during a trend or before a new trend begins. A pause within a strong trend may precede continuation, while a range at another point may come before a move in a different direction.
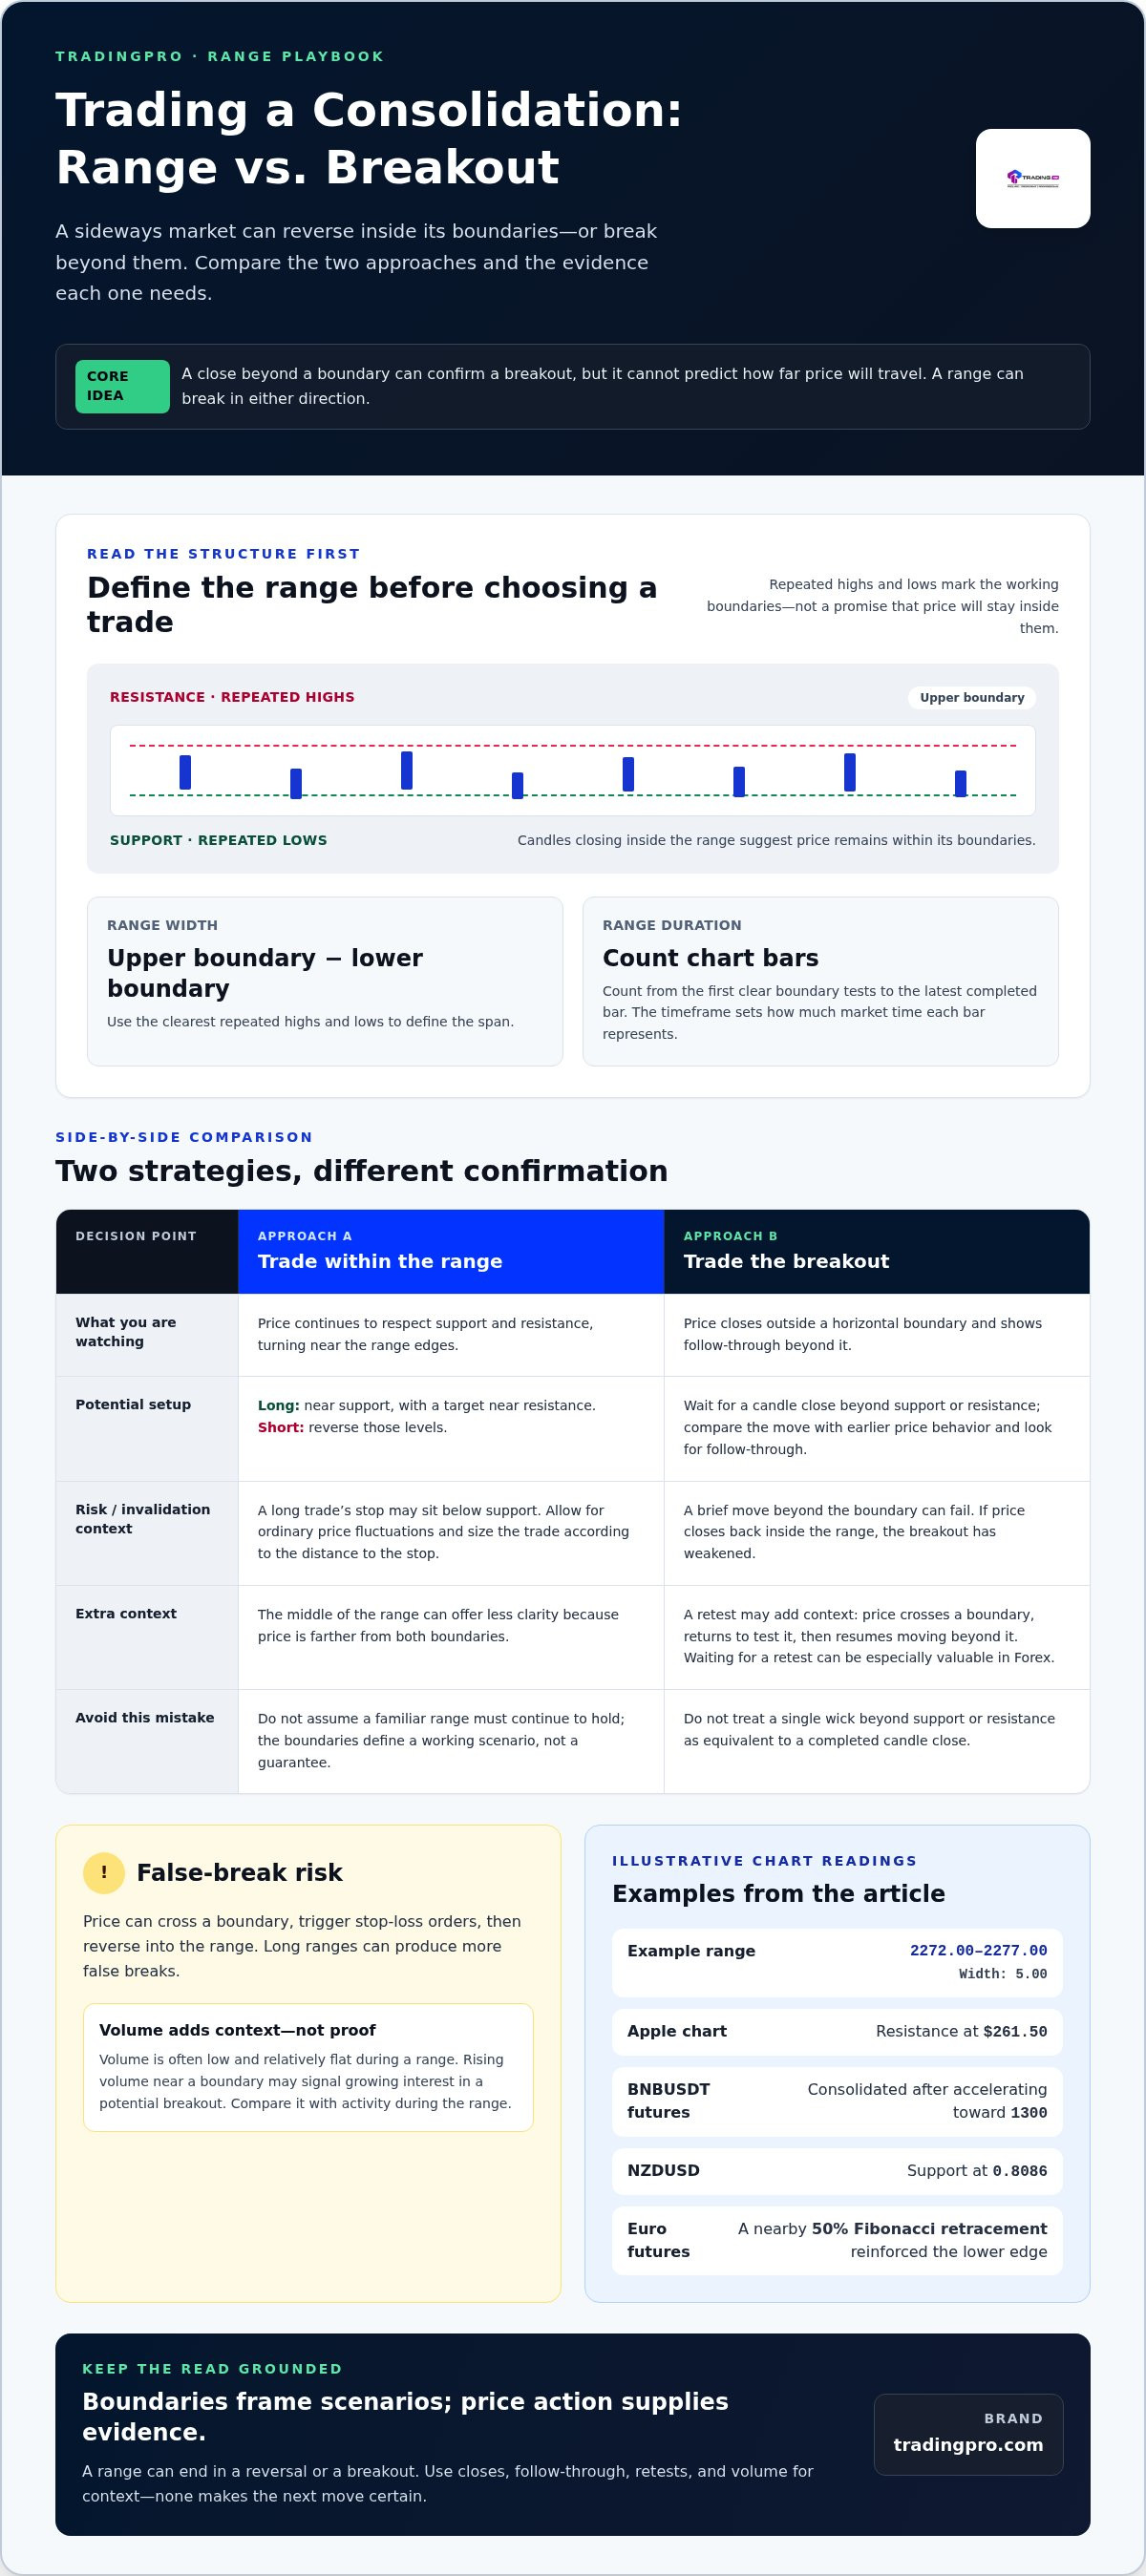
To map trading consolidation zones, mark the clearest upper and lower boundaries using repeated price highs and lows. Calculate the range’s width by subtracting the lower boundary from the upper boundary. Measure its duration by counting the chart bars from the first clear boundary tests to the latest completed bar. The timeframe determines how much market time each bar represents.
The boundaries frame two possibilities: price may reverse inside the range or break out and move beyond it. A close outside a horizontal range can confirm a breakout, but it does not show how far price will travel. Compare the move with earlier price behavior and look for follow-through. A brief move beyond support or resistance can fail, with price returning inside the range.
Volume adds context. Trading volume is often low and relatively flat during a range, while rising volume near a boundary can signal growing interest in a potential breakout. Compare boundary volume with activity during the range rather than treating one increase as proof. A quiet range can reflect low market activity, so a change in participation may matter more than the range’s appearance alone.
False breakouts create practical risk: price can cross a boundary, trigger stop-loss orders, then reverse into the range. Long ranges can produce more false breaks. For a range trade, a long position’s stop may sit below support and its target near resistance; reverse those levels for a short position. Allow for ordinary price fluctuations, and size the trade according to the distance to the stop.
For breakout trades, a retest can offer another signal: price crosses a boundary, returns to test it, then resumes moving beyond it. In Forex, waiting for a breakout retest can be especially valuable. If price closes back inside the range, the breakout has weakened. Do not treat a single wick beyond support or resistance as equivalent to a completed candle close.
Forex pairs and equities can show the same basic range structure, but their chart context differs. For example, an Apple chart may show resistance at $261.50 after an opening decline, forming the range’s upper boundary. Mark the lower boundary separately, then assess closes and volume around both levels. This turns a sideways chart into a defined setup, with reversal and breakout scenarios tied to observable price action.
2. Example of a consolidation price range
At this level, buyers and sellers temporarily agree on a price, so neither side sustains a move. Identify repeated turning points on the chart and draw horizontal lines around the range’s highs and lows. These boundaries make the market structure visible: you can see where buying interest has appeared and where selling has returned. The lines define a working range, not a promise that price will remain inside it.
A separate example shows how a range can follow a sharp move. BNBUSDT futures accelerated toward the psychological level of 1300 before entering consolidation. Rather than chase the earlier advance, traders can mark the sideways area that followed and observe whether price keeps respecting its boundaries. That context matters: a pause after a rise may behave differently from a range formed after a decline, even when both look horizontal.
One example range has prices from 2272.00 to 2277.00. Its width is the distance between those boundaries. Traders can watch how price behaves near each edge: repeated rebounds near the lower line may support a range-trading plan, while repeated rejection near the upper line may identify resistance. NZDUSD offers another reference point, with support at 0.8086. A clearly marked support level helps distinguish an ordinary move within the range from a change in its structure.
Range-trading strategies focus on movement between the boundaries. A trader may consider buying near support and selling near resistance, while assessing how consistently price has respected each level. The middle of the range can offer less clarity because price is farther from both boundaries. Before acting, define the planned entry, exit, and point at which the range idea no longer holds. Base the plan on observed price behavior, not an assumption that a familiar pattern must repeat.
Not every boundary is perfectly horizontal. In euro futures, a nearby 50% Fibonacci retracement reinforced the lower edge of a consolidation. That overlap gives traders another piece of chart context, but it doesn’t replace observing price. Compare the level with recent reactions, then note whether price holds, rejects, or moves through it. A boundary supported by more than one visible reference can be easier to assess than an isolated line.
These examples show how to turn a chart into a defined scenario: mark the range, assess its edges, and choose a strategy that fits the observed structure. If you’re ready to put your trading plan into practice, use TradingPRO account registration as your next step.
3. How to learn to analyze consolidations?
Start with a price chart and mark areas where candles repeatedly stall. A possible consolidation forms when price remains between established support and resistance for an extended period. Draw a horizontal line across repeated highs and another across repeated lows. Check that several price reactions support each boundary, since one isolated peak or dip can mislead. Then note whether candles keep closing inside the range or begin pressing toward one edge. This gives you a testable structure before considering an entry.
To identify a range, compare repeated chart reactions with trend lines, support, resistance, and volume. ADX readings below 25 or 20 can indicate no clear trend, but ADX alone doesn’t define the boundaries. A consolidation indicator can flag periods when price stays within an ATR-defined range around a simple moving average over a specified number of bars. Treat its output as a starting point, then compare its marked area with actual price highs and lows.
Use a higher timeframe to establish context, then a lower timeframe to refine possible entries. For example, identify the range on an H1 chart, then examine M5 for a potential entry and confirmation. The higher timeframe shows the broader structure; the lower timeframe reveals more detail inside it. Don’t let a smaller chart erase the larger range. Check whether a lower-timeframe move is still contained by H1 support and resistance before interpreting it as a breakout.
Timeframe and asset class change how a range appears. A single bar represents different amounts of time across H1 and M5, so the same market pause can look compact on one chart and detailed on another. Different assets also move on different price scales and show different volatility. Compare each range with that asset’s recent price behavior, rather than applying identical point-width expectations to Forex, equities, or futures.
Set indicator inputs to match the timeframe and asset class you are analyzing. An ATR-based Consolidation Zones indicator depends on its moving-average reference, ATR range, and chosen bar count. If the marked zone shifts when you change those settings, inspect the chart directly before relying on the signal. Cross-check the zone against volume, trend lines, and established support or resistance. Agreement among these tools provides stronger context than one indicator alone.
Build a repeatable routine: mark the range on the higher chart, record its boundaries, and move down only to study price behavior. On M5, look for candles holding or rejecting an H1 boundary, then compare volume and the latest swing structure. ADX below 25 or 20 can support a range interpretation, while a close beyond the marked range changes the setup. This process turns chart reading into a sequence of observations, not a prediction based on one candle.
4. Indicators and candlestick patterns
Indicators can add structure to a chart, but each measures a different feature. Bollinger Bands track price movement around a moving average, and the bands often narrow as consolidation develops. Look at the contraction alongside horizontal support and resistance. Narrow bands show reduced volatility, not the direction of the next move. If price pushes beyond a band, compare the move with the range boundary and trading volume before interpreting it as a breakout.
ADX helps assess trend strength rather than forecast direction. Readings below 25 or 20 can indicate that no clear trend is present, which supports a consolidation reading. Compare ADX with the visible chart: low readings during repeated reversals between boundaries fit a range, while a rising reading can signal strengthening momentum. Don’t use ADX alone to set an entry. It doesn’t identify whether buyers or sellers will take control.
RSI and the Stochastic Oscillator can help identify overbought or oversold conditions inside a range. For example, a trader might watch for an overbought reading near resistance or an oversold reading near support. Treat those readings as context, not automatic trade instructions. A strong move can keep an oscillator at an extreme while price continues through a boundary. Check whether price is still respecting the range before using oscillator signals.
Candlesticks can show hesitation around key levels. Doji candles have closely matched opening and closing prices; Hammer and Spinning Top patterns can also appear during consolidation. Note where a pattern forms: a Doji near established resistance has different context from one in the middle of a range. Record the candle’s high, low, and closing position, then compare later candles to see whether price remains inside the zone.
Settings matter. The Consolidation Zones indicator identifies periods when price stays within an ATR-defined range around a simple moving average over a specified number of bars. Adjust the settings to suit the asset class and preferred timeframe, then compare the marked area with price action. A setting suited to a slower chart may highlight too much noise on a faster chart. Note the settings used when reviewing each chart.
Use a consistent sequence to combine these tools. First, mark support and resistance using repeated price reactions. Next, check whether Bollinger Bands are narrowing and whether ADX shows weak trend strength. Then inspect RSI, Stochastic, and candles near the range edges. Finally, compare volume and wait for a candle close beyond the boundary before treating a breakout as confirmed. If the signals conflict, record the disagreement rather than forcing a trade setup.
5. Definition of trading consolidation as a sideways market phase
Consolidation describes a market phase in which price moves sideways instead of making sustained progress in one direction. Buyers and sellers keep meeting near similar prices, creating a temporary balance between supply and demand. On a chart, that balance appears as repeated turns, overlapping candles, and limited directional follow-through. It is a pause in price movement, not proof that the market has become inactive or that a breakout must follow.
Sideways phases can form within a trend or before a new trend begins. A flag, for example, slopes against the preceding move and forms between trend waves. It can indicate potential continuation, but the pattern alone does not establish what price will do next. Horizontal ranges have flatter boundaries, while triangles, wedges, and pennants narrow as price swings contract. These shapes describe different structures within the broader consolidation phase.
Consolidation can reflect low market activity, with major participants less active, or a period when larger participants accumulate or distribute positions. The chart alone does not reveal who is trading or why. Instead, assess observable behavior: whether price keeps returning to familiar levels, whether swings are narrowing, and whether activity changes near an edge. Volume is often low and flat during a range; a rise near a boundary can signal increased participation.
Another useful concept is the Point of Control, or POC. In a consolidation profile, it marks the center and the price at which the market found agreement. The POC adds a reference inside the range, while support and resistance describe its outer boundaries. Price repeatedly returning toward the POC can suggest acceptance around that level. A move away may show a changing balance, but needs confirmation from subsequent price action.
Consolidation occurs more often than sustained trending movement, so recognizing a pause is a core chart-reading skill. A longer, narrower range is associated with a stronger subsequent breakout, but this relationship doesn’t identify the breakout’s direction. In a gold-futures example, price formed a double top around $4380 before later bearish dynamics. That sequence illustrates why a recognizable pattern provides context, not certainty about the next move.
The practical takeaway is to label the phase before choosing a strategy. Mark whether the structure is horizontal, sloping, or narrowing; then note its boundaries, center, and surrounding trend. Wait for directional momentum rather than forcing a trend interpretation onto sideways candles. Consolidation is the market’s state, while breakout or reversal describes a possible next development. Create an account to put your chart analysis into practice with a defined plan.
TradingPRO: Rookie Account
TradingPRO’s Rookie Account is a next step for traders ready to apply chart analysis to their trading. Use the range-reading process in this guide to build a clear plan: define the boundaries, note what would confirm a breakout, and decide where the setup no longer holds. Tie each decision to your own analysis and risk limits.
TradingPRO also offers Micro, Pro, and Scalp Accounts for different trading approaches. Trading involves significant risk, and you may lose capital; past performance does not indicate future results. Choose an account that aligns with your experience and trading objectives.
Visit TradingPRO to explore the Rookie Account or contact the team.
Build Your Next Trading Decision With Purpose
Make your next step a repeatable process, not a reaction to every flicker on the chart. Before each trade, record the reason for entry, the evidence that would change your view, and the setup’s risk limit. Review those notes after the trade closes. Over time, this gives you a clearer way to assess decisions and refine your approach. Trading consolidation zones can provide useful chart context, but analysis cannot remove market risk. Trading involves significant risk, and you may lose capital; past performance does not indicate future results.
Choose an account that aligns with your experience and preferred trading style. TradingPRO offers Rookie, Micro, Pro, and Scalp Accounts. Consider which option fits the way you plan to trade, and keep your focus on disciplined decisions rather than chasing a fast result. A deliberate next step gives you room to apply what you have learned with a clear plan.
Explore your next step with TradingPRO and move forward with purpose.
Frequently Asked Questions
What is consolidation in trading?
Consolidation is a period when price pauses its directional progress and trades within a relatively contained area. Traders use a zone rather than one exact price because reactions often cluster around support and resistance. For example, repeated failures to advance past an upper chart area, paired with rebounds near its lower area, can define a range. Watch whether new candles stay within those reaction areas or move beyond them.
How to Trade a Consolidation Phase?
Choose a plan that fits the chart’s current structure. A range-based approach focuses on reactions near support and resistance; a breakout approach waits for price to leave the established range. Before entering, write down the condition that supports your setup and what would invalidate it. If price sits between the boundaries without a clear signal, waiting is a valid decision. Review completed trades to see whether you applied your rules consistently.
How to determine the direction of a consolidation breakout?
The breakout direction cannot be known with complete certainty before price moves. Look for evidence as price approaches or crosses a boundary: a candle close outside the range, increasing volume, and continued movement in the same direction. A return inside the range weakens the breakout case. For example, if price closes above resistance but the next candles fall back within the range, treat that as conflicting evidence rather than confirmation.
How to learn to analyze consolidations?
Build a chart journal using different assets and market conditions. For each example, record the range boundaries, the preceding trend, volume behavior, and what happened after price left the area. Then compare your notes with the completed chart. This makes it easier to see which observations helped and which signals misled you. Keep indicator settings consistent during comparisons, or changes can make charts harder to compare.
Intro – what is a consolidation?
A consolidation is a transitional phase in which price action loses clear directional progress. It can develop after an advance, after a decline, or before a fresh move begins. Treat it as a market condition to identify, not a signal to buy or sell by itself. Its shape, location, and behavior around nearby levels provide context for deciding what to watch next.
What is a Consolidation Area?
A consolidation area is the chart region containing the market’s repeated price activity during a sideways phase. Its outer edges show where price has struggled to continue, while the Point of Control can identify the profile’s central price of agreement. These references serve different purposes: boundaries frame the range, and the center shows where activity concentrated. Compare the area with surrounding price structure before drawing conclusions.
What markets and timeframes are best for working with consolidations?
No single market or timeframe is best for every trading plan. Consolidations appear in Forex, equities, and futures, but each asset has its own volatility and chart behavior. Choose a timeframe that provides enough detail for your decisions without obscuring the broader structure. Compare the same asset across chart intervals, then select the view that makes your boundaries and trade conditions easiest to define.
What’s the difference between a flat and a consolidation?
“Flat” often describes a sideways market, so traders sometimes use it as a synonym for consolidation. The word also has another meaning: a trader is “flat” when they hold no open positions. Context tells you which meaning applies. For example, “the market is flat” refers to price movement, while “I’m flat on EUR/USD” means the trader has no active EUR/USD trade.


