


- Published on: 2026-10-29 10:17:12
How to Manage Entries and Exits with a 4-Hour Chart Trading Strategy

The strongest 4-hour chart trading strategy manages the whole trade, not just the entry: use the daily chart for direction, seek a confirmed setup near support or a swing point, and place the stop beyond market structure. As price reaches a planned target, take partial profit and consider moving the stop to breakeven. This gives each decision a clear place in the plan.
A precise entry matters, but it is only one part of a trade. You also need to know what would invalidate the setup, when to reduce exposure, and whether the wider trend supports holding the position. Without that structure, it is easy to react to every candle instead of following a consistent process.
Here, you’ll learn how to combine daily-chart context with H4 entries, confirm a setup after the candle closes, and manage risk with a protective stop, partial profits, and a breakeven move. The steps bring the plan together from market direction to trade exit, so you can make each decision with purpose.
Key Takeaways
- Use support, swing points, and confirmation from a completed candle to shape a more deliberate entry.
- Plan chart reviews around H4 candle closes instead of reacting to every price movement.
- Set profit-taking and stop adjustments in advance, so you know how you’ll manage a trade as it develops.
- Size risk around the distance to your stop, and treat lower-time-frame signals with care when they conflict with broader structure.
- Use the daily chart to frame the trend, then let the H4 chart refine swing-trade setups.
Entering trades near support or swing points
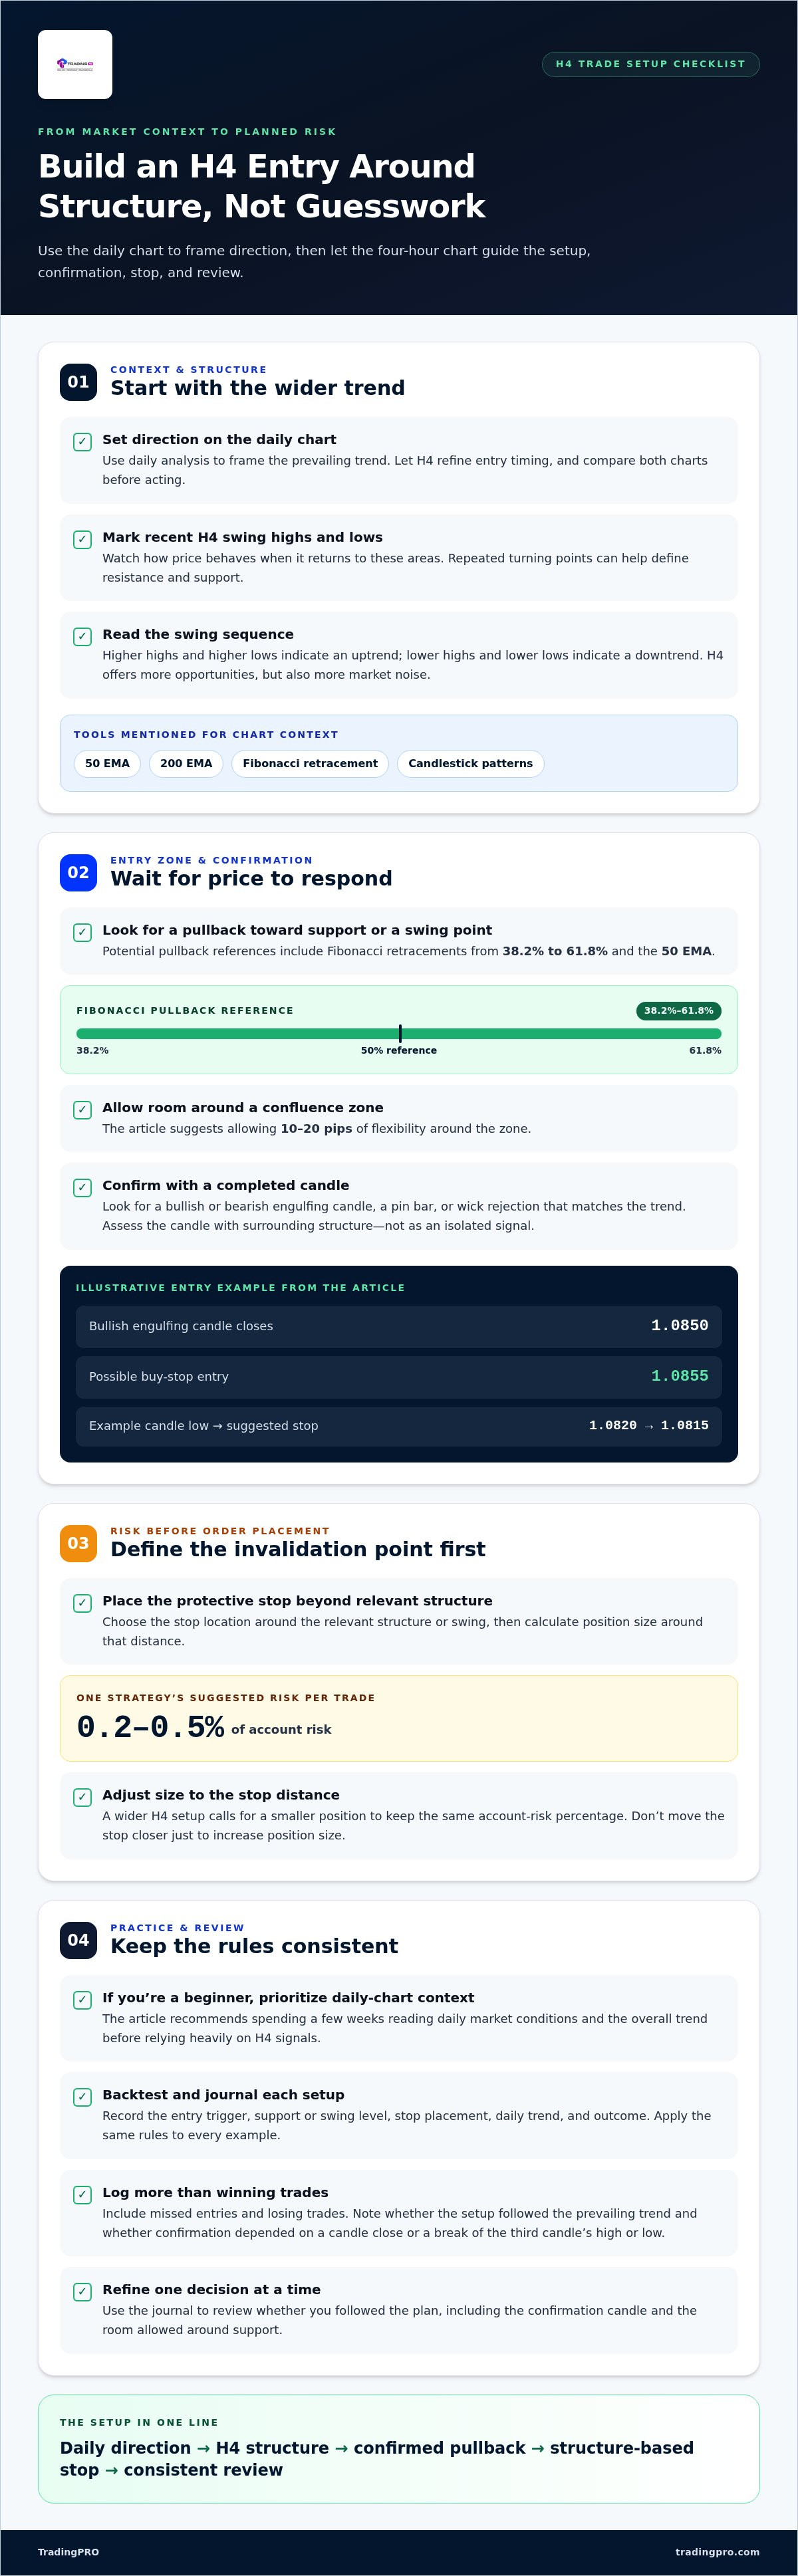
Use the daily chart to establish direction, then use the four-hour chart to locate a support-based entry and define the setup. Common tools include the 50 EMA, 200 EMA, Fibonacci retracement levels, and candle patterns such as engulfing candles or pin bars. On H4, mark repeated swing highs and lows as resistance and support, then assess whether price is making higher highs and higher lows or lower highs and lower lows.
-
Identify Support, Resistance, and Trend
Mark recent swing highs and lows on the four-hour chart, then watch how price behaves when it returns to those areas. A level where price repeatedly turns can help define support or resistance, while higher highs and higher lows indicate an uptrend. Compare the H4 structure with the daily chart before taking action; the shorter chart offers more opportunities, but also more market noise.
-
Choose Trade Entry Techniques
Wait for price to pull back toward a support area or swing point, then look for confirmation rather than entering on contact alone. Fibonacci retracements from 38.2% to 61.8% and the 50 EMA can help identify possible pullback zones. Allow 10-20 pips of flexibility around a confluence zone, and look for a bullish engulfing candle, bearish engulfing candle, pin bar, or wick rejection that matches the trend.
For example, after a bullish engulfing candle closes at 1.0850, a buy-stop entry at 1.0855 is one possible technique. Another approach is to enter when the fourth candle opens, or wait for the third candle’s high or low to break. In the same example, a candle low of 1.0820 corresponds to a suggested stop-loss at 1.0815.
- Set risk before placing the trade. Choose the stop location beyond the relevant structure or swing, then adjust position size to keep the planned loss within your chosen risk limit. One strategy recommends risking 0.2-0.5% per trade. The stop distance matters: a wider H4 setup requires a smaller position to keep the same account-risk percentage. Don’t move the stop closer just to increase position size.
For beginners, the daily chart is recommended as the primary timeframe. Spend a few weeks reading its market conditions and overall trend before relying heavily on H4 signals. The four-hour chart can then refine entry timing, while daily analysis helps filter setups that run against the broader direction.
- Backtest and journal each setup. Review historical charts and record the entry trigger, support or swing level, stop placement, daily trend, and outcome. Apply the same rules to every example, including whether confirmation requires a candle close or a break of the third candle’s high or low. A journal helps you see whether your analysis follows the plan or shifts after price moves.
Compare your logged H4 trades with daily-chart context, and note whether the setup followed the prevailing trend. Record missed entries and losing trades as well as winners. This gives you evidence to refine one decision at a time, such as the confirmation candle or the amount of room allowed around support.
What is the H4 Forex Trading Strategy?
An H4 forex strategy uses four-hour candles to plan entries and manage trades. It suits swing trading, especially in forex; equity traders can also use the chart, which shows two bars per trading session when the market is open for eight to nine hours.
-
Schedule Checks Around Candle Closes
Set chart reviews around completed candles, not every price fluctuation. Each H4 candle represents four hours of price action, and six candles form each day. A common schedule heading into mid-2026 anchored candles to the 5pm New York close, the standard daily close in forex.
Using that schedule, candles close at 1, 5, and 9 AM and PM Eastern Time. The corresponding closing times are 4, 8, and 12 AM/PM Central Time, or 2, 6, and 10 AM/PM Pacific Time. Allow a ten-minute block after a close to review the chart, assess risk, and decide whether the setup still qualifies.
Limit checks to candle closes where possible. The plan suggests reviewing the chart five to six times a day, with a 10-15 minute review when a candle closes. A trader awake for four of the six daily candles can use those reviews to track price without trying to monitor every move.
-
Use Candlestick Triggers for Confirmation
Wait for a candle to close before confirming the setup and taking action. A bullish engulfing candle can support a long entry, while a bearish engulfing candle can support a short entry. A pin bar or wick rejection can also signal that price has responded at a level. Read the candle alongside the surrounding structure, not as an isolated signal.
Treat a Doji as a sign of indecision, not a complete trade signal. The Doji Sandwich is a three-bar reversal pattern: in a bullish version, the first candle is bearish and the last is bullish. The pattern is considered stronger when the third candle closes above the first candle’s high. Wait for that close to confirm it.
-
Place Entry Orders After Confirmation
Choose your entry rule only after the confirmation candle closes. You can enter when the next candle opens or wait for price to break the confirmation candle’s high or low. The first approach enters sooner; the second requires price to move beyond the trigger. Decide which rule to follow before the candle forms, rather than choosing mid-move.
Before placing an order, compare its trigger with the setup’s invalidation point and planned stop. If price has already moved far from the confirmation level, reassess the trade instead of chasing it. This keeps entry action tied to the original analysis, not the urge to participate. If you’re ready to put a trading routine into practice, begin with trading account registration.
Breakeven stops and partial profit-taking
Decide your exit rules before entering. Set a target, define when to reduce the position, and specify when to move the stop to breakeven.
-
Set Profit Targets
Use the previous swing high as an initial target for a bullish trade, or the previous swing low for a bearish trade. These levels give price action a clear reference point. Set the target before entry, then compare its distance with the stop distance to see whether the trade fits your plan.
A minimum risk-to-reward ratio of 1:2 can serve as a starting point for target placement. For example, if the planned loss equals one unit of risk, a target at twice that distance matches the ratio. Treat this as a planning rule, not a prediction that price will reach the target.
-
Apply Breakeven Stops and Partial Exits
Once price reaches the first target, consider closing part of the position and moving the remaining stop to breakeven or a trailing position. Another trigger is a gain equal to the initial risk, known as 1R. Choose one rule in advance; changing it during a trade can turn a consistent exit plan into a reaction to each candle.
For example, with a target 150 pips away, the plan describes closing half the position after a 75-pip move. The remaining portion can stay open under the planned stop rule. A breakeven stop moves the exit to the entry price, while a trailing stop follows favorable price movement according to your chosen method.
- Keep exit decisions tied to market structure. If a bullish trade reaches a previous high, assess whether price is stalling or continuing through resistance. For a bearish trade near a previous low, watch for rejection or a decisive break. Evaluate the price action after the next candle closes, rather than changing the target because of an intrabar fluctuation.
Write down the target, partial-close point, and stop adjustment before placing the trade. For instance, record whether reaching the first target means taking partial profit and moving the stop, or whether the stop changes only after the trade gains 1R. Apply the same rule to bullish and bearish setups, then review whether each exit followed the plan.
How to Manage Your Trade?
Set the stop, position size, and profit target before entering. On an H4 chart, base each choice on market structure and the distance between entry and stop.
-
Account for Risk and Lower-Time-Frame Noise
Keep your decision-making anchored to the H4 setup instead of reacting to every lower-time-frame fluctuation. Charts below the 5-minute timeframe can be extremely noisy and prone to false signals without a solid strategy and disciplined risk management. A brief move against your position on a faster chart doesn't automatically invalidate the H4 structure.
Use a lower timeframe only when it supports a specific execution decision. If its signals conflict with the H4 direction, return to the planned setup rather than moving the stop impulsively. The key risk is letting short-term noise override the reason for the trade.
-
Determine Position Size and Risk-Reward
Calculate your position size from the distance between entry and stop, then set the account risk you’re prepared to take. One plan recommends risking 0.2-0.5% per trade; another guideline describes a small, fixed percentage, typically 1-2%. Treat these as separate approaches, and apply one consistent risk rule rather than combining them.
For example, risking 1% of a $5,000 account means $50 at risk. If the setup needs a 40-pip stop, size the position so that stop represents the planned loss. A 1:2 risk-to-reward ratio would place the target 80 pips from entry, before considering whether market structure supports that objective.
-
Set Stop-Loss and Take-Profit Levels
Place the stop just beyond the structure or last swing that would invalidate the setup. In a three-candle Doji pattern, place the protective stop below the Doji candle. For a long trade, a break below that low challenges the bullish setup. For a short trade, assess the relevant swing or structure above entry.
Set the take-profit from a clear price level and the planned risk-to-reward ratio. In the EUR/USD example, an entry at 1.0855 with a 40-pip stop and a 1:2 ratio gives a target at 1.0935, 80 pips above entry. Recalculate position size if the structural stop changes.
-
Avoid Common Trading Mistakes
Write down the stop, target, risk, and invalidation point before placing the order. Common mistakes include widening a stop after price moves against the position, increasing the position size to compensate for a wider stop, and treating every lower-time-frame signal as a reason to exit. Each one breaks the original risk plan.
Review the H4 candle close before changing direction or resistance levels. A faster chart can show a false signal, particularly below the 5-minute timeframe. If price reaches the planned stop, accept the exit; if the setup remains intact, manage it using the rules recorded before entry.
Combining daily and 4-hour charts for swing trading
Use the daily chart to frame direction and the H4 chart to refine swing setups. This top-down process keeps short-term entries connected to broader market structure.
- Map the broad direction on the weekly and daily charts. Start with weekly structure, then mark the daily trend and key levels. An uptrend often forms higher highs and higher lows; a downtrend forms lower highs and lower lows. If the daily chart shows rising swing lows, treat that structure as context for evaluating potential long setups on H4, not as an entry signal by itself.
Keep the charts in sequence: weekly for broad direction, daily for important levels, and four-hour for setup refinement. This separation gives each timeframe a defined job. Avoid letting a small H4 move rewrite the daily trend before the larger structure changes.
- Mark daily levels before searching for H4 entries. Draw the support and resistance areas that stand out on the daily chart, then check how H4 price behaves as it approaches them. A daily support area paired with an H4 higher low may offer a clearer long setup than an H4 signal far from a major level. For short setups, assess resistance and evidence of weakening structure.
Record the level and the H4 condition you need before acting. For example, a trader might wait for price to reach daily support, then look for an H4 reversal pattern. The level supplies context; the completed H4 candle helps define whether a setup is taking shape.
- Use the H4 chart to refine, not contradict, the daily plan. An H4 pullback can occur inside a broader daily uptrend, so distinguish a countertrend move from a genuine change in direction. Compare recent H4 highs and lows with the daily structure. If H4 price breaks a key daily level, reassess the setup instead of treating the older bias as fixed.
A 200 moving average can provide long-term guidance and help frame how long to stay in a trade. Read its position alongside price structure, not as a standalone signal. The daily chart sets the wider context; H4 candles provide the closer view needed to manage the swing.
- Keep the review focused on completed candles. At each H4 close, compare price with the marked daily levels and ask whether the setup still fits the broader direction. This creates a repeatable check rather than minute-by-minute reactions to small fluctuations. If daily and H4 structure disagree, pause and define which level or candle close would change your view.
For beginners, this framework builds a clear hierarchy: weekly context, daily levels, then H4 execution. Review each trade afterward and note whether the entry followed that sequence. To put a trading routine into practice, start your trading registration.
TradingPRO: Rookie Account
TradingPRO’s Rookie Account is a natural next step for traders putting an H4 plan into practice. Use the process from this guide to define your market context, entry conditions, stop placement, and exit rules before making trading decisions. A written plan helps keep your actions consistent as you review how each setup develops.
Choose an account tier that aligns with your trading approach: Rookie, Micro, Pro, or Scalp. The right fit depends on how you plan to trade and the account environment you want to use. Compare the options with your routine and goals, and remember that account choice does not replace risk management.
Visit TradingPRO to explore the Rookie Account and decide whether it fits your next step.
Build a Trading Routine You Can Refine
Turn your chart rules into a repeatable routine. Before each trade, write down what would make the setup valid and what would invalidate it. Afterward, compare your decisions with your plan. Reviewing the process rather than focusing on a single result can help you identify habits to keep and decisions to adjust.
A 4-hour chart trading strategy becomes more useful when its rules stay clear across changing market conditions. Keep refining one part at a time, such as how you confirm a setup or when you reduce a position. Consistent notes make those adjustments more deliberate and help you build confidence through practice, not impulse.
Ready to take your next step? Explore TradingPRO registration and put your trading routine into action.
Frequently Asked Questions
What About the Weekly and Monthly Charts?
Use weekly and monthly charts to add broader context, then move down to daily and H4 charts to plan a swing trade. For example, a monthly resistance area can help explain why a daily uptrend is slowing, while H4 shows how price responds near that area. Treat higher-timeframe levels as context, not automatic entry signals. Keep the chart sequence consistent so short-term price movements don’t distort the wider market view.
What’s the Best Time Frame for Trading Overall?
There’s no single best timeframe for every trader; it depends on how often you can review charts and how quickly you want to act. Beginners are advised to use the daily chart as their primary timeframe, while H4 offers more trading opportunities with more market noise. Day traders can use a 1-hour chart for analysis and bias, then a 15-minute chart for structure or patterns.
What is a 4-hour chart trading strategy?
A 4-hour chart trading strategy uses candles that each represent four hours of price action to identify setups and manage trades. A trader can combine daily-chart direction with H4 structure, then plan an entry around a completed candle rather than reacting to every price fluctuation. The approach can suit swing trading because it gives trades room to develop while offering more frequent setups than a daily-only approach.
What are the rules for entering a 4-hour chart trade?
Define the broader direction, identify a relevant support or resistance area, and wait for an H4 candle to close with a clear trigger. For a long setup, that could be a bullish engulfing candle; for a short setup, a bearish engulfing candle. Set the entry and protective stop before placing an order. If price moves away before the planned trigger, don’t chase it with an unplanned entry.
How should position size and risk per trade be calculated?
Choose the amount of account equity you’re willing to risk, then divide that risk by the loss per unit at your planned stop. For example, risking 1% of a $5,000 account means $50 at risk. A 40-pip stop then determines the position size that keeps the planned loss within that amount. A wider stop requires a smaller position for the same risk limit.
How do 4-hour chart strategies compare with daily and 1-hour strategies?
H4 sits between the slower daily chart and the faster 1-hour chart. Daily candles help beginners assess broader market conditions, while H4 can show more setups but also more noise. A 1-hour chart can help day traders assess bias or refine an entry. For swing trading, use the daily chart to set context and H4 to inspect the setup, rather than treating the timeframes as competing systems.
How should traders backtest a 4-hour chart strategy?
Write the rules first, then review historical H4 candles in order without skipping losing setups. Record the market context, entry trigger, stop, target, and whether each trade followed the rules. Include different market conditions and track results consistently; otherwise, a few memorable examples can distort your assessment. After reviewing the sample, change one rule at a time and test it again against the same process.
When do 4-hour candles close in major markets and time zones?
Forex H4 candle closing times depend on the chart’s candle schedule. With a schedule anchored to the 5pm New York close, listed closes are 1, 5, and 9 AM and PM Eastern Time, 4, 8, and 12 AM/PM Central Time, and 2, 6, and 10 AM/PM Pacific Time. Confirm the chart’s displayed timezone and candle boundaries before scheduling reviews, since platform settings affect the timestamps you see.


