


- Published on: 2026-11-03 01:41:03
How Much Can You Realistically Earn From Trading Each Month?

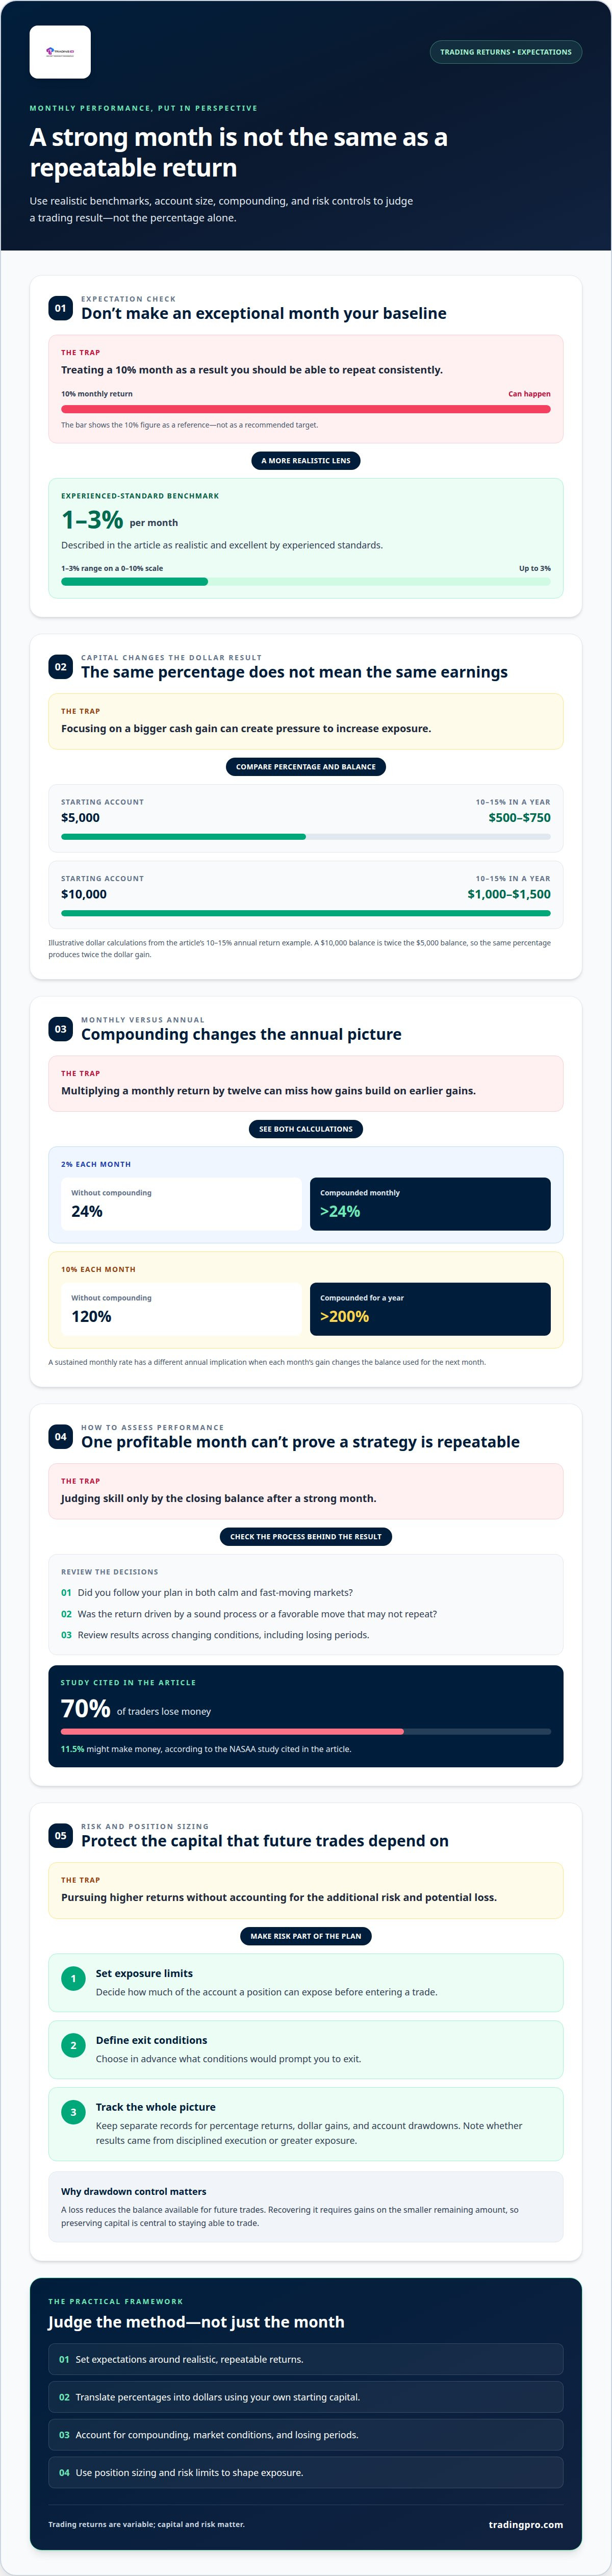
Consistent trading gains are measured in modest percentages, not dramatic monthly leaps. For traders asking what a good monthly return for trading looks like, 1-3% per month is considered realistic and excellent by experienced standards. A 10% month can happen, but expecting to repeat it consistently isn’t realistic for most traders.
It’s natural to focus on the percentage: a higher return can seem like the quickest route to meaningful earnings. But the same percentage produces very different dollar gains depending on your starting capital, and pursuing bigger returns can also mean taking on more risk.
This guide explains how capital and compounding shape potential earnings, why experience and market volatility affect results, and how risk management influences what may be sustainable. You’ll get a practical framework for setting expectations, distinguishing a strong month from a repeatable approach, and understanding the trade-offs behind monthly targets.
Key Takeaways
- Compare monthly goals with annual growth: compounding can make modest, sustained returns add up over time.
- Translate a percentage return into dollars using your own starting capital to set practical expectations.
- Account for experience and market volatility when assessing results; a strong month alone doesn’t show whether a strategy is repeatable.
- Use position sizing and risk management to shape exposure, not just to pursue higher returns.
- Match your trading approach to your needs and experience, then explore an account type that fits your style.
Annual return assumptions and compounding
Annual benchmarks can put monthly targets in perspective, but they aren’t forecasts for an individual trading account. Compare the rate, time period, and compounding method before treating a percentage as a realistic expectation.
The S&P 500’s long-term average return is around 7-10% per year. A trader averaging 2% monthly would exceed that stated annual benchmark, but the comparison depends on sustained results and monthly compounding. Compounding 2% each month produces more than 24% over a year, because each month’s gain builds on the previous balance.
That difference changes how a target sounds. A 10% monthly return equals 120% annually without compounding, and more than 200% when compounded for a full year. Those figures show why a seemingly small monthly percentage can imply an aggressive annual outcome. Returns significantly higher than 10% annually are often unrealistic for consistent, long-term growth.
Compounding Monthly Returns
Monthly returns compound when each period’s gain or loss changes the balance used to calculate the next period’s result. This matters because a steady monthly percentage doesn’t translate directly into the same percentage multiplied by twelve. For example, 10% monthly compounds to more than 200% over a full year, while the non-compounded calculation is 120% annually. The method changes the annual picture.
Compounding Account Growth
Compounding account growth means returns accumulate on both the starting capital and earlier gains that remain in the account. That can accelerate growth over time, but losses also reduce the base for later returns. An illustrative calculation can show how an investment may grow when returns accumulate over time. The result depends on the assumed rate and period.
Keep the benchmark distinct from a trading target. The 4% retirement rule is a guideline for making retirement savings last at least 30 years. It suggests withdrawing 4% of savings in the first year of retirement, then adjusting the amount for inflation each year afterward. That is a withdrawal approach, not a monthly trading-return target.
Risk-free returns offer another reference point, not a promise or direct substitute for trading performance. The study reports a risk-free return of 0.592 percent, according to the Board of Governors of the Federal Reserve System. Compare such rates carefully: trading returns vary with market exposure, while a risk-free rate serves as a different kind of benchmark.
Use annual and monthly figures together. Check whether a stated return is compounded, whether gains stay in the account, and how long the assumption applies. These details show the implied growth more clearly than a monthly percentage alone.
How starting capital affects potential earnings
A monthly percentage and its dollar value are different measures. A $5,000 account and a $10,000 account can earn the same percentage, but the larger balance produces twice the dollar gain. Starting capital shapes potential earnings; it doesn’t determine whether a strategy can repeat its results.
For a $5,000 or $10,000 account, earning 10-15% per year is a big accomplishment. These simple calculations show how a strong percentage can still translate into modest earnings when the starting balance is small.
Consider the same return target across both balances. The percentage is identical, but the dollar outcome differs. This distinction helps set practical expectations and prevents traders from increasing exposure simply to chase a larger cash result.
There isn’t a fixed monthly drawdown attached to a particular return target. The same return can come with different swings, depending on position size, market movement, and how losses are controlled. Aiming for higher investment returns involves taking on more risk, including the risk of losing money, according to the U.S. Department of Labor.
Protect capital by treating risk limits as part of your strategy, not an afterthought. Define how much of the account a position can expose, and decide in advance what conditions would prompt you to exit. A loss reduces the balance available for future trades, so recovering it requires gains on the smaller remaining amount. This makes drawdown control central to preserving your ability to trade.
Scale capital based on evidence from actual trading, not pressure to reach a preferred income. Review results across changing market conditions, including losing periods, and assess whether you followed your rules. If performance depends on a few unusually strong trades, adding funds can magnify that concentration rather than improve consistency. Increase capital only when your process remains clear and repeatable.
Keep separate records for percentage returns, dollar gains, and account drawdowns. Compare each month with the account balance at its start, then note whether the result came from disciplined execution or greater exposure. That makes progress easier to judge across different balances. Once your capital limits and trading plan are clear, you can continue with TradingPRO registration.
Experience, skill, and market volatility
Trading experience affects how decisions hold up when prices move quickly. A developing trader may follow a plan in calm conditions, then abandon it after an unexpected swing. An experienced trader may recognize how changing conditions affect entries, exits, and position selection. That doesn’t remove market risk, but it can help keep decisions aligned with a tested approach.
A NASAA study cited in the research found that 70% of traders lose money, while only 11.5% might make money. These figures underline why a profitable month alone says little about a trader’s overall skill. A return can come from a sound process, or from a favorable market move that may not repeat. Review the decisions behind the result, not only the closing balance.
Skill shows in consistent execution across different market conditions. For example, record the reason for each entry, the planned exit, and whether the position followed your strategy. When volatility rises, compare those records with trades made during quieter periods. If you change rules impulsively after a loss or sudden price move, your performance figures may reflect emotion rather than a repeatable edge.
Market volatility changes the pace and scale of price movements. A strategy built around gradual movement may behave differently during sharp swings, while a quick-entry approach may face more noise and rapid reversals. Understand the conditions your strategy is designed for. Match the setup to the market, and don’t treat a single strong session as proof that the same approach suits every environment.
Experience also helps traders interpret losing trades. One loss may come from a planned trade that simply moved against the position; another may expose a mistake, such as entering without a clear exit. Those outcomes call for different responses. Review whether you followed the original plan, then adjust only when the evidence points to a flaw. Changing rules after every loss makes performance harder to assess.
Use a trading journal to connect market conditions, decisions, and outcomes. Note the market environment, the strategy used, and whether you followed each rule. Group trades by setup rather than judging them as one long sequence. This can reveal whether results depend on a particular condition or remain consistent across varied markets. Each review gives experience a practical role by helping sharpen your next decision.
Set return expectations based on observed performance across different conditions, not the best month in your record. Even a capable trader can face losing periods when volatility shifts or a strategy no longer fits the market. Evaluate gains and losses, then identify which decisions were repeatable. This makes monthly results more informative and keeps skill, market conditions, and strategy fit in view.
Risk management and position sizing
Position sizing determines how much account capital is exposed to a trade. Risk management links that exposure to a planned exit, so a return target doesn’t determine trade size on its own. Before entering, define the setup, the price that invalidates it, and the amount of capital exposed if that exit is reached. This makes the potential loss clear before market movement puts pressure on your decision.
Calculate position size using the distance between entry and planned exit, alongside the amount you’re prepared to lose. The wider the exit distance, the smaller the position needs to be to keep exposure unchanged. For example, if a trade needs more room because prices are moving sharply, reduce the position rather than widening the exit while keeping the same size. This ties trade size to the setup, not emotion.
A $10,000 account shows why percentages and dollars need separate attention. A given percentage move on a small position has a smaller account impact than the same move on a large position. Review the planned loss in both percentage and dollar terms before opening a trade. The figures should make sense against the account balance and your broader plan, not just the potential gain.
Drawdowns reduce the capital available for later trades. After a loss, the remaining balance is smaller, so a subsequent gain is calculated from a reduced base. Avoid increasing position size to recover quickly. Instead, review whether you followed the original exit, whether the market invalidated the setup, and whether the next trade still fits your risk limits.
Aiming for higher investment returns involves taking on more risk, including the risk of losing money, according to the U.S. Department of Labor. This trade-off matters when a monthly goal tempts you to add exposure. A target alone doesn’t show the volatility or potential loss behind it. Assess both sides of each trade before deciding whether its possible reward justifies the account risk.
Several open trades can expose an account to similar market movements. For example, positions in instruments affected by the same market event may lose together, even if they appear to be separate trades. Review your combined exposure before adding another position. This portfolio-level view can reveal concentrations that a single-trade calculation misses.
Use a repeatable review for every planned trade:
- Write down the entry reason and the price that invalidates the setup.
- Set position size from the planned exit distance and account exposure.
- Check how the trade interacts with other open positions.
- Record the result and whether you followed the plan.
This process makes a monthly return more meaningful. It ties the outcome to specific decisions, position sizes, and exits, rather than treating the final percentage as the whole story.
Realistic monthly trading returns
Consistent monthly returns of 1-3% are considered realistic and excellent by experienced standards, while 5-10% can occur in strong months. Set goals from your strategy’s observed results and risk limits, not from the biggest gain you’ve seen.
Comparing Returns With Market Benchmarks
Benchmarking compares a trading result with a market alternative over a matching period. The S&P 500’s long-term average return is around 7-10% per year, while Treasury bills have yields tied to their own terms. Convert the trading result to an annual basis, then compare the same periods. A monthly gain can look impressive alone, but its annualized implication may signal a much more demanding target.
Good Returns and Sustainable Returns
A good return is a strong result for a period; a sustainable return is one a strategy can pursue repeatedly without relying on exceptional conditions. Sustained annual returns of 4-10% are described as good, with discipline, risk management, and diversification needed for consistency. A single 5-10% month may be positive, but it doesn’t establish a repeatable pattern. Evaluate the method and risk behind the gain.
Returns After Fees and Taxes
A net return is what remains after trading costs and taxes reduce the gross result. A realistic target after those deductions depends on trading activity, instrument, and tax treatment, so the 1-3% monthly range shouldn’t be treated as a guaranteed net outcome. Track costs against each trade and distinguish gross performance from the balance change after expenses. Tax treatment depends on jurisdiction and circumstances, so include it in your own return calculations.
Consistent Day Trader Profitability
A cited NASAA study found that only 11.5% of traders might make money. That figure doesn’t establish what share of day traders remain consistently profitable, so don’t interpret a profitable month as evidence of long-term consistency. Judge performance across market conditions and include losing periods. The quality of the process matters as much as the headline return.
Build a monthly goal from your strategy’s recorded performance, trading costs, and ability to tolerate losses. Keep the target aligned with the risk limits you set before entering trades; raising exposure just to reach a percentage can undermine the plan. Compare results with relevant benchmarks over matching periods, and review whether gains came from repeatable decisions. If you’re ready to put your trading approach into practice, register with TradingPRO.
TradingPRO: Rookie Account
TradingPRO’s Rookie Account is an option for newer traders putting realistic return expectations into practice. Choose an account with your experience, trading approach, and risk plan in mind, not a monthly percentage alone. TradingPRO also offers Micro, Pro, and Scalp Accounts, giving traders different account tiers to consider as their needs and style evolve.
Before you begin, set a return goal you can evaluate alongside drawdowns, trading costs, and how consistently you follow your strategy. Your account choice supports your trading approach; it doesn’t determine your results. Explore the Rookie Account and decide whether it fits your next step at tradingpro.com.
Set your next trading objective with intention
The useful answer to what is a good monthly return for trading isn’t a number detached from your approach. It’s a goal you can assess against your decisions, risk limits, and ability to follow your plan through different market conditions. Make your next step practical: define what you’ll track, what would prompt a review, and how you’ll distinguish a sound process from a lucky outcome.
TradingPRO offers Rookie, Micro, and Pro Accounts for traders considering an account aligned with their approach. No account can ensure a particular return, so keep your target grounded in your own strategy and risk tolerance. If you’re ready to explore your next step, register with TradingPRO.
Build deliberately, review each decision, and let disciplined execution guide your progress.
Frequently Asked Questions
How Much % Does a Good Trader Return Per Month?
For a trader asking what is a good monthly return for trading, a consistent 1-3% per month is considered realistic and excellent by experienced standards. Treat that range as a reference, not a score every trader must reach. Compare your result with your plan and the risk taken. A month below target can still show disciplined execution, while a larger gain may deserve closer review if it came from an unusual trade.
Is it realistic to make 1% a day as a trader?
Making 1% every day is not a realistic baseline for most traders. Repeated daily gains compound quickly, so a daily target can imply an exceptionally high return over time. It can also encourage oversized positions or trades that don’t fit the strategy. Assess performance across winning and losing sessions, and set goals from documented results rather than assuming each trading day will produce a gain.
What is considered a good monthly return for a trader?
A practical way to answer what is a good monthly return for trading is to consider whether the result fits the trader’s strategy and risk limits. A 1-3% monthly result is considered realistic and excellent by experienced standards. To assess your own performance, note whether you followed entry and exit rules, how much risk you took, and whether the outcome came from your repeatable approach or an unusually favorable trade.
What are typical monthly returns for retail traders?
There isn’t one dependable monthly figure that describes every retail trader. Results vary with strategy, market conditions, trading activity, and risk exposure. The cited NASAA findings indicate that making money is difficult for traders, but they don’t establish a typical monthly return for all retail traders. For your own comparison, track performance across multiple market conditions and separate realized gains from open positions that could still change.
How do you calculate monthly trading returns, including compounding?
Calculate a simple monthly return by dividing the account’s net profit by its starting balance, then expressing the result as a percentage. Adjust for deposits and withdrawals so cash added isn’t mistaken for trading profit. For compounding across months, multiply each month’s growth factor, such as (1 + monthly return), then subtract one from the total product. This captures gains building on the changing account balance.
How do leverage and position sizing affect monthly trading returns and losses?
Leverage lets a trader control a larger position relative to the capital committed, magnifying the effect of price movements on account equity. Position sizing determines how much exposure each trade adds. Together, they can increase both gains and losses, so calculate the effect of an adverse move before entering. Review total exposure across open positions as well, since trades responding to the same market event can amplify a monthly drawdown.
What percentage of day traders are consistently profitable?
The cited NASAA study found that 11.5% of traders might make money, but that figure does not establish how many are consistently profitable.


