


- Published on: 2026-11-10 18:16:02
Forward Testing Price Action Models With Capital and Risk in View

A price-action model can look convincing on historical charts yet behave differently when real capital is exposed to live markets. Forward testing price action models with real capital shows how execution, risk limits, and changing conditions affect results beyond the backtest.
That difference matters. A promising signal alone doesn’t show how a strategy interacts with other positions or how uncertain its results may be. A disciplined forward test keeps these factors in view, so decisions are based on observed performance and controlled exposure, not confidence in a chart pattern.
Learn how to assess risk, consider portfolio diversification, and account for model uncertainty when testing price-action approaches in live conditions. The sections ahead explain what forward testing can reveal, where its limits remain, and how to interpret results before deciding whether a model warrants a larger role.
Key Takeaways
- Match test capital to your risk limits and the strategy’s exposure, rather than choosing an amount based on confidence alone.
- Evaluate a model across relevant market conditions, not just after a short run of favorable trades.
- Track execution quality, drawdown, and consistency alongside headline returns to understand how the strategy behaves live.
- Use diversification to assess how a model interacts with other positions and where portfolio-level risk may concentrate.
- Compare live results with backtests and paper trading to identify the effects of execution, costs, and model assumptions.
Model assumptions and uncertainty
A price-action setup is a hypothesis, not a certain forecast. It assumes features such as a breakout, rejection, or trend continuation can help estimate an expected return. Forward testing price action models with real capital puts that idea to the test under live execution. It cannot prove that a pattern will persist across every stock, market regime, or trading session.
The Capital Asset Pricing Model, introduced in the 1960s, assumes a linear relationship between risk and expected return. In its example, a stock with beta 1.2 and an expected market return of 10% has a CAPM-predicted expected return of 12%. Beta 1 means expected movement in line with the market; beta above 1 implies greater volatility. These are model estimates, not promises about a stock’s next move.
CAPM is an asset-pricing model for forecasting returns on risk-bearing asset classes, but empirical tests found a weaker relationship between risk and return than the theory suggested. Its beta can also vary across market cycles. The Fama-French three-factor model adds size and value factors to address effects that standard beta doesn’t explain. Each added factor changes the model’s assumptions; it doesn’t remove uncertainty from the analysis.
For a price-action test, record the conditions behind each signal: instrument, timeframe, entry trigger, exit rule, and market context. Then distinguish the model’s signal from portfolio exposure. A breakout may behave differently in a broad stock-market rally than during a sharp reversal. Diversification can reduce dependence on one position, but holdings exposed to the same market factors may still move together.
Account for commissions, spreads, slippage, and market impact by recording them for every trade and calculating results after costs. Compare planned entry and exit prices with actual fills. A price-action model that works only before execution costs may not be viable in live trading.
Scale up only when live results follow the model’s predefined rules and stay within its risk limits across varied conditions. Revise the model only when evidence points to a specific weakness, then test the changed rules separately. Stop if the model repeatedly breaches its limits or its edge disappears after costs. Don’t treat a short winning streak as proof.
Diversification changes what a portfolio depends on, but it does not make a price-action signal more certain. The page says that holding upwards of 30 stocks can help diversify away company-specific risk, assuming the holdings are not all from the same sector. This qualification matters: a larger holding count alone does not establish that exposures are genuinely different. Review whether positions may share sensitivities before treating them as independent sources of risk.
Use that review to distinguish the number of holdings in a portfolio from the assumptions behind its risk controls. If several positions respond to similar market conditions, they may not provide the separation the strategy relies on. Record why each holding is included and consider how the portfolio would behave if shared conditions changed. This does not guarantee protection or validate the trading signal, but it makes the limits of the diversification assumption more visible. Reassess those assumptions alongside the price-action rules instead of treating a spread of holdings as evidence that the model will remain reliable. Keep conclusions proportionate to the observed results.
How much real capital should you allocate to forward test a trading strategy?
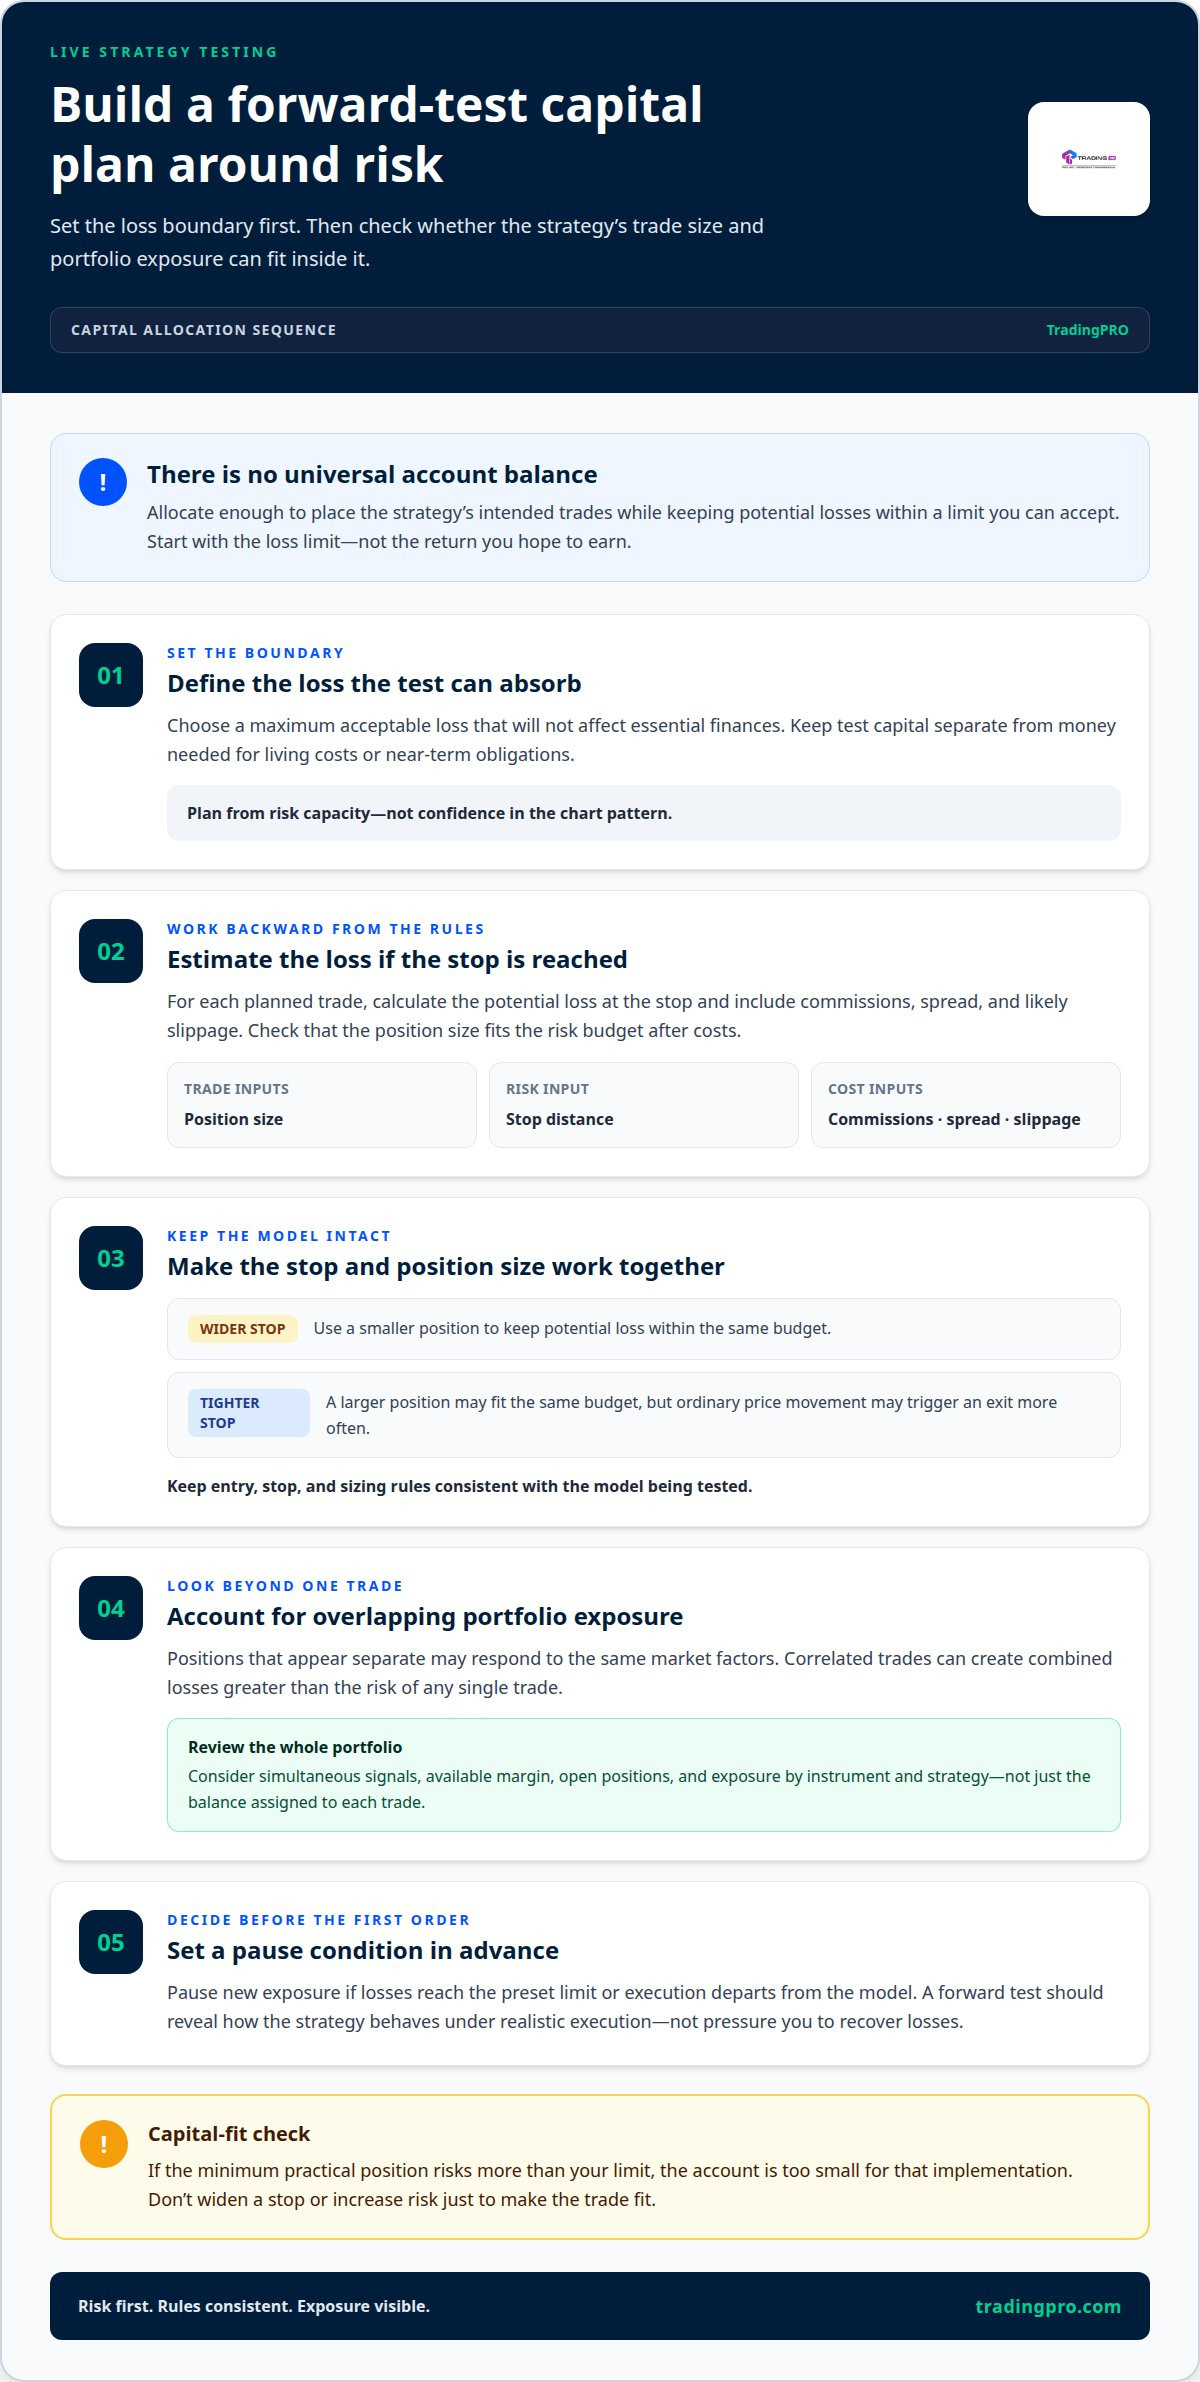
There’s no universal account balance that makes a forward test valid. Allocate enough to place the strategy’s intended trades while keeping potential losses within a limit you can accept. Start with that loss limit, not the return you hope to earn. Keep test capital separate from money needed for living costs or near-term obligations.
Work backward from the strategy’s rules. For each planned trade, estimate the loss if the stop is reached, then include commissions, spread, and likely slippage. Position size must fit the risk budget after those costs. If the minimum position size risks more than your limit, the account is too small for that implementation. Don’t widen a stop or increase risk just to make the trade fit.
For example, imagine a price-action model that enters after a breakout and exits at a predefined stop. A wider stop requires a smaller position to keep potential loss within the same budget. A tighter stop may allow a larger position, but ordinary price movement may trigger an exit more often. Keep the entry, stop, and sizing rules consistent with the model you’re testing.
Then account for portfolio exposure. Several trades may look separate while responding to the same market factors. If a test opens positions in correlated stocks, their combined losses may exceed the risk of any single trade. Allocate capital with the whole portfolio, available margin, and other open positions in mind. Record exposure by instrument and strategy, not just the balance assigned to each trade.
A useful allocation plan sets boundaries before the first order:
- Risk capacity: Define the maximum loss the test can absorb without affecting essential finances.
- Trade mechanics: Confirm position size, stop distance, transaction costs, and margin fit that boundary.
- Portfolio overlap: Leave room for simultaneous signals and correlated positions.
- Review trigger: Pause new exposure if losses reach the preset limit or execution departs from the model.
Forward testing should reveal how the strategy behaves under realistic execution, not pressure you to recover losses. If the available capital cannot support the model’s minimum practical position while respecting your limits, use a lower-exposure testing approach first. For a live account that fits a defined plan, review account options and register.
How long should you forward test a price action model before evaluating it?
Set the test duration according to the model’s trade frequency and the conditions it needs to encounter. A fast intraday breakout model may generate observations quickly, while a selective reversal setup may go longer between signals. A calendar deadline alone can mislead: a quiet stretch may produce too few trades to assess execution, rule consistency, or outcomes. Define the evidence you need before the first live trade.
Start by describing the strategy’s operating conditions. Specify its instruments, trading hours, setup criteria, and exit rules. Then identify conditions that could change its behavior, such as a strong trend, a range-bound market, or a sharp reversal. A model designed for trend continuation cannot be meaningfully judged only during a sideways stretch. Let the test capture relevant variation instead of stopping after a favorable run.
Trade count matters, but it doesn’t measure time completely. A cluster of signals in one market phase may reflect the same underlying conditions. Compare those trades with signals from different sessions or environments. For example, review a stock-breakout model across both clean breakouts and failed moves. This helps show whether results depend on one narrow pattern.
Use staged reviews instead of declaring success after the first winning trades. At each review, check whether entries followed the written rules, exits matched the plan, and actual fills changed the outcome. If signals are sparse, keep collecting evidence. If execution errors appear, correct the process before drawing conclusions about the model’s predictive value.
A practical review framework can keep the test focused:
- Before launch: Record the setup, market conditions, and evidence needed to evaluate it.
- During the test: Log every eligible signal, including skipped trades and the reason for each decision.
- At each review: Separate rule-following results from errors, unusual market conditions, and execution effects.
- Before changing rules: Save the original results, then treat revised criteria as a distinct test.
Keep the original model unchanged while gathering its first body of evidence. Adjusting it by discretion after each loss can make the test a moving target. If a rule needs revision, document the specific problem, preserve the original record, and evaluate the revised version independently. This helps distinguish a genuine improvement from a change that merely fits past trades.
Evaluate the model when the test includes enough varied, rule-compliant trades to assess its behavior, not simply when a chosen date arrives. If the evidence is concentrated in one condition, extend the test. Forward testing is an ongoing measurement process: continue monitoring after evaluation, especially when market conditions or execution patterns shift.
What metrics should you track when forward testing a trading strategy live?
Track performance and process separately. Net return shows the account outcome after trading costs, while rule adherence shows whether the test followed the model. A profitable result with missed entries or discretionary exits may not represent the written strategy. Log each signal, order, fill, exit, and rule deviation so every result has context.
Measure trade expectancy alongside win rate. Expectancy combines the average winning trade, average losing trade, and proportion of wins and losses. A high win rate can still conceal poor performance if losing trades are larger than winning ones. Compare these measures under the same strategy rules and market conditions instead of relying on one headline result.
- Net expectancy: Calculate average profit or loss per trade after commissions, spread, and slippage.
- Average win and loss: Compare typical winning trades with typical losing trades to expose an unbalanced payoff.
- Win rate: Read it together with trade size and loss size, never as a standalone success measure.
- Maximum drawdown: Record the largest decline from an account peak to a later trough.
- Profit factor: Compare gross profits with gross losses across the same set of trades.
Drawdown adds a risk perspective that net return can conceal. Record its depth, duration, and recovery path. For example, two models can finish with similar gains, yet one may experience a sharper decline that exceeds your planned tolerance. Compare each decline with the strategy’s risk limits and account exposure, including overlapping positions.
Execution metrics reveal whether live trading changes the model’s results. Record intended entry and exit prices alongside actual fill prices. Track spread, slippage, partial fills, rejected orders, and the time between signal and execution. If a breakout signal repeatedly fills beyond the planned level, separate that execution effect from the signal’s theoretical performance.
Include consistency measures. Track results by instrument, setup type, session, and market condition. A strategy might appear profitable overall because one setup or market phase dominates its trades. Breakdowns show where performance is concentrated and whether losses cluster in particular conditions. Define categories before reviewing outcomes to avoid changing the analysis after seeing results.
Finally, measure portfolio exposure, not just individual trades. Record simultaneous positions, concentration by instrument, and exposure to related price moves. Separate stock trades may share the same market direction. These records help explain portfolio drawdown when each position appears acceptable on its own.
Use a consistent trade log and review the same set of metrics at each evaluation. Separate model performance, execution quality, and portfolio risk. This structure makes it easier to identify whether a change comes from the price-action rules, trade handling, or combined exposure.
Beta can provide context for how an investment’s expected return relates to the market, but it does not guarantee actual returns. A 15% hurdle against an appropriate 10% rate may miss investments returning above 10% but below 15%; a 5% hurdle may admit suboptimal assets.
How do live trading results compare with backtest and paper trading results
A backtest applies written rules to historical price data. It shows how a strategy might have behaved, not how orders would have filled in real time. Results depend on data quality, execution assumptions, and whether the rules were defined before testing. For example, a historical signal may appear tradable at a candle’s closing price, while a live order may not fill until after that price has moved.
Paper trading tests a strategy in current market conditions without putting capital at risk. It can reveal timing issues, missed signals, and whether the rules are practical during a live session. But simulated orders may not reflect the queue, available liquidity, or actual fill prices for a real order. Recording a paper trade at a desired price does not show that a live order would have received the same fill.
Live trading adds actual execution and financial consequences. A market order may fill at a different price from the displayed quote, while a limit order may not fill at all. Spreads, slippage, commissions, and delays can reduce results compared with a backtest or paper-trading log. Real exposure can also affect decisions: a trader may hesitate, exit early, or skip a valid signal after a loss.
Compare the three stages using identical entry, exit, and position-sizing rules. Match the instrument and timeframe where possible, then investigate differences trade by trade. If the backtest enters at the signal price, paper trading records a later quote, and live execution fills later still, the gap points to execution assumptions. If all stages show weaker outcomes in a particular market condition, review the model’s assumptions more closely.
- Backtest: Tests rules against historical data and depends on the quality of that data and execution assumptions.
- Paper trading: Observes current signals without financial exposure, but simulated fills may differ from executable orders.
- Live trading: Records actual fills and real trading decisions, including the effects of costs and exposure.
Keep separate records for each stage. Compare signal time, intended price, fill price, exit, and net result for every matched trade. Don’t combine simulated and live outcomes into one performance figure. A clear side-by-side review shows whether the gap comes from historical assumptions, simulated execution, live costs, or changes in trading behavior.
Use that comparison to decide what the evidence supports. A strong backtest followed by weaker paper results may indicate a regime or signal issue. Strong paper results followed by weaker live execution may expose a fill or cost gap. Open an account to put your live-testing plan into practice, with defined rules and exposure limits.
TradingPRO
TradingPRO offers account options for traders moving from model evaluation to live market participation. The Rookie, Micro, Pro, and Scalp Accounts provide distinct tiers for different trading styles, including approaches that require careful attention to position size and execution.
Choose an account in line with your testing plan, risk limits, and intended trading approach. A price-action model still needs clear entry rules, measured exposure, and ongoing review; an account choice does not validate the model or remove market risk. If you’re ready to discuss how TradingPRO may fit your next step, contact TradingPRO.
Carry your testing discipline into the next decision
Treat forward testing price action models with real capital as an ongoing decision process, not a one-time pass or fail. As market conditions change, revisit your model’s assumptions and decide whether its role still fits your objectives and risk tolerance. Keep the next step deliberate: preserve what the evidence supports, and don’t increase exposure simply because recent results look strong.
A clear plan gives every decision a reason. Set out what you want to learn, how you’ll assess progress, and what would prompt a pause or change. Then choose an account structure that suits your trading approach, without treating the account itself as proof that a model works.
Ready to discuss how to approach your next step? Contact TradingPRO to discuss your approach. Build with care, keep learning from live evidence, and move forward with purpose.
Frequently Asked Questions
What is forward testing a price action trading model with real capital?
It means applying a defined price-action strategy to current market conditions using an account with actual financial exposure. Unlike a historical replay, the test records decisions as prices move, including whether an order could be placed and how it was filled. For example, a trader can log a live support-level rejection, the planned trade, and its executed outcome to assess how the model performs in practice.
What rules limit position size and risk per trade during a live test?
Set limits in the test plan before placing trades. Define the maximum acceptable loss per position, the conditions for exiting, and the total exposure allowed across open trades. Size each position according to its entry-to-stop distance, so a wider stop means less exposure under the same loss limit. Include related positions in the total, since several trades can respond to the same market move.
What are the main risks of forward testing with real money, and how can you limit losses?
The main risks are losing capital, receiving worse fills than expected, and making inconsistent decisions under pressure. Limit exposure to an amount you can afford to risk, use predefined exits, and avoid adding to a position simply to recover a loss. Record skipped signals and rule changes, too. Those notes help separate model performance from decisions made after a trade moves against you.


